
MyARM - Application Response Measurement Tools
is a complete implementation of ARM, the Application Response Measurement Standard of The Open Group. It provides a platform-neutral, vendor-independent platform for end-to-end transaction and application response time monitoring and performance management.
As a co-author of the ARM 4.0 standard deep inside knowledge found its way into the ARM 4.0 compliant MyARM implementation.
On the right you see a screenshot of our web-based user interface for measurement analysis. See our screenshot section for additional views of our user interface.
To better understand how ARM (e.g. MyARM) works please follow the next steps:
- Identify
 Instrument
- Test And Verify
- Deploy And Monitor
- Analyse
- Application Definition
- Client-App (Client)
- AppServer-App (Server)
- Transaction Definition
- Find-Customer-By-Name (Client)
- SOAP-Request (Server)
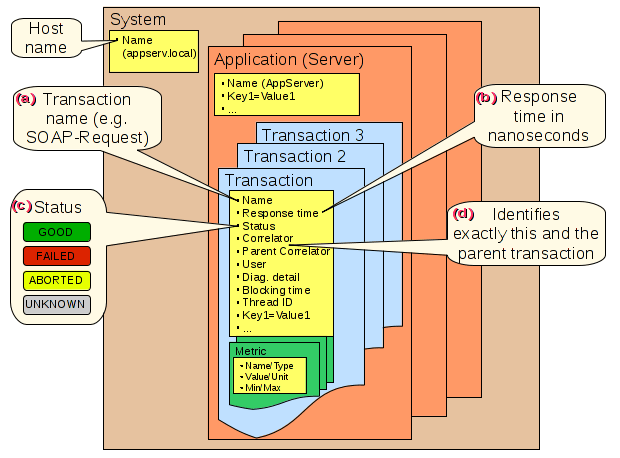
- Provide a meaningful name (e.g. SOAP-Request for processing a SOAP request)
- Verify that the measured response times are in a scale you would expect. Note: You should have an expectation how long a transaction measurement should take. If not, please make an estimate
- Provide the appropriate status for transactions which are successful or failed due to some reason
- Pass the correct parent correlator to children
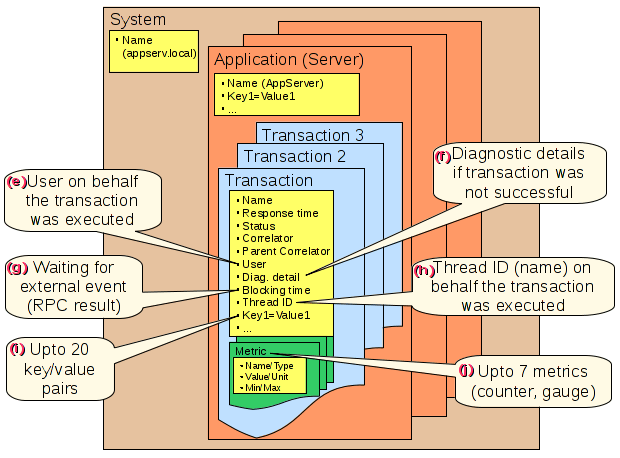
- Associate an user name or id on which behalf the transaction was executed, if available
- If a transaction execution was not successful you can provide more information as a so-called diagnostic detail string (up to 4096 characters, e.g. a SQL command which failed)
- If your transaction needs to wait for external events you can use the blocking concept of ARM to see the exact blocking conditions (in microsecond granularity)
- In multi-threading environments you can associate the thread ID or name on which behalf the transaction was executed
- Attach some metrics to associate current state of your transaction (e.g. level of a queue as a gauge)
- Provide context information (e.g. customer ID) to measurements for further filtering and analysis
- The Client and Server applications running on their hosts use the ARM interface to measure the defined ARM transactions
- The MyARM ARM agent implementation processes those measurements and forwards them to the myarmdaemon using an efficient protocol on top of TCP/IP
- The myarmdaemon receives the incoming measurements and stores them in the configured database
- We support MySQL®, MariaDB® and SQLite® databases
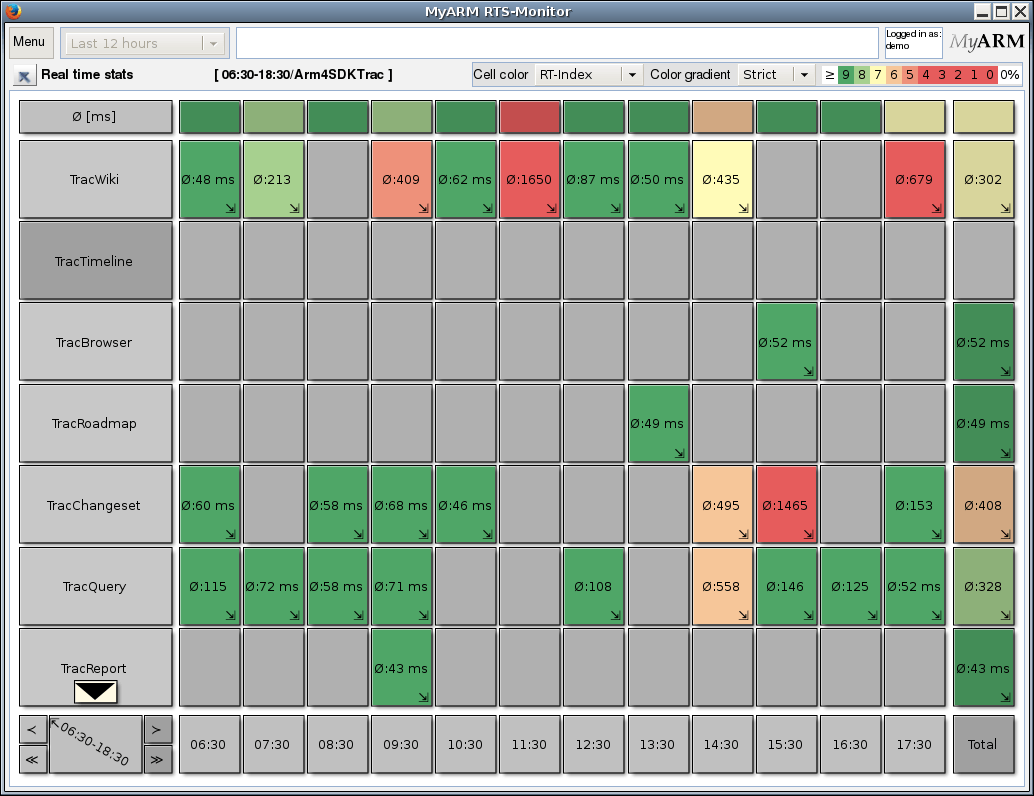
- The monitor overview displays response times statistics of a demo web-site of the last 12 hours at the time the screenshot was taken.
- It shows three response time groups:
- HTTP request measurements of the arm4sdk.org web-site (offline since 2021)
- Transaction measurements of a CDDB-Demo
- Overall HTTP request statistics of the myarm.info and arm4sdk.org web-site (offline since 2021)
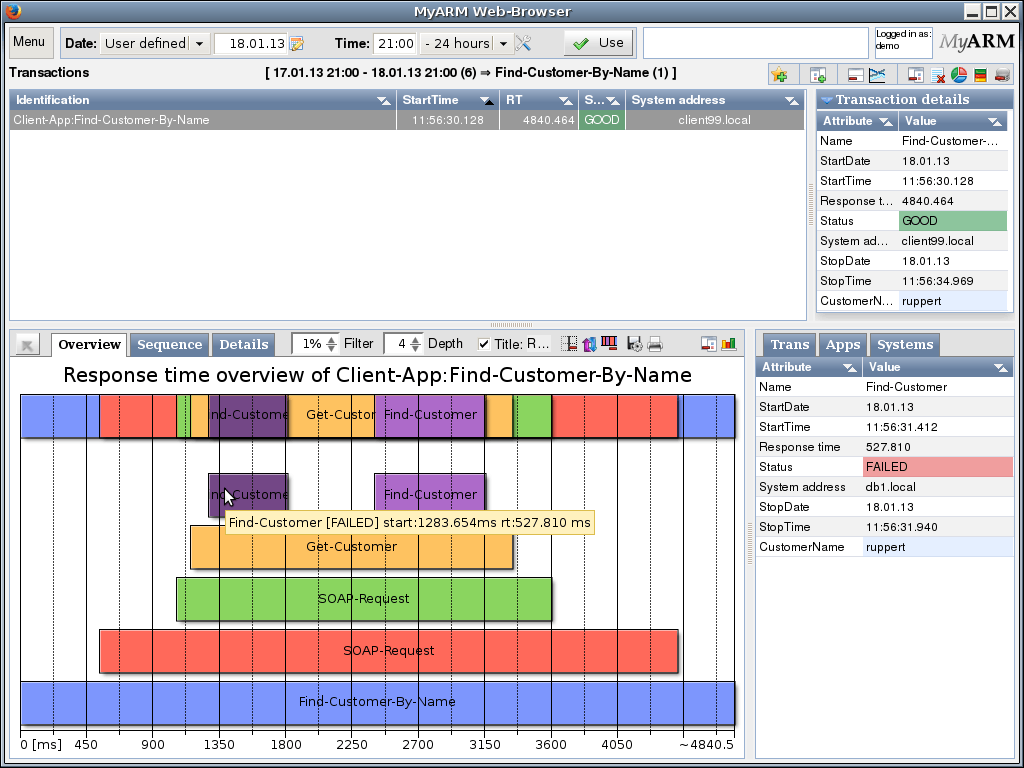
- The last 12 hours monitoring view displays all HTTP request measurement statistics of the arm4sdk.org web-site (offline since 2021)
- In the diagram, the box under the mouse was clicked. This has displayed details of the appropriate transaction measurement on the right
- On the right a pie chart is drawn which shows the distribution of the total response time regarding the transaction name
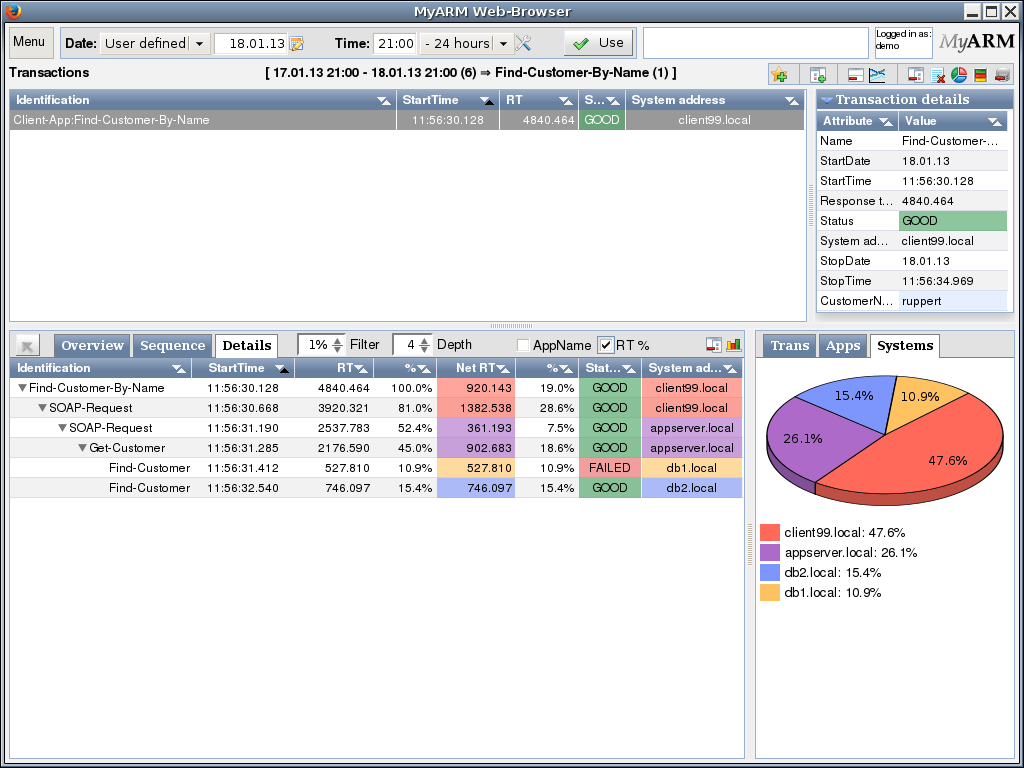
- On the right a pie chart is drawn which shows the distribution of the percentaged total response time executed on a specific system
Identify and design 'Unit Of Work' of interest
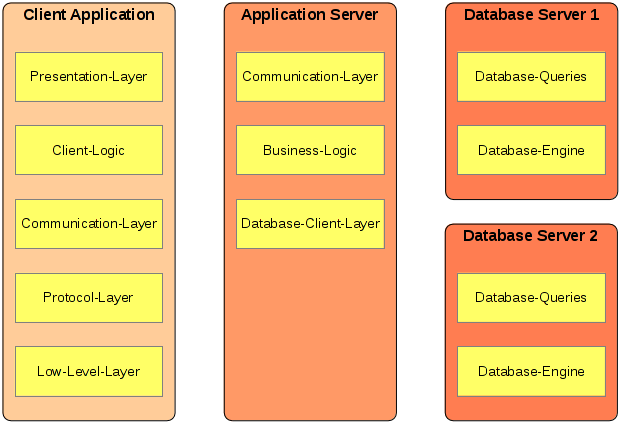
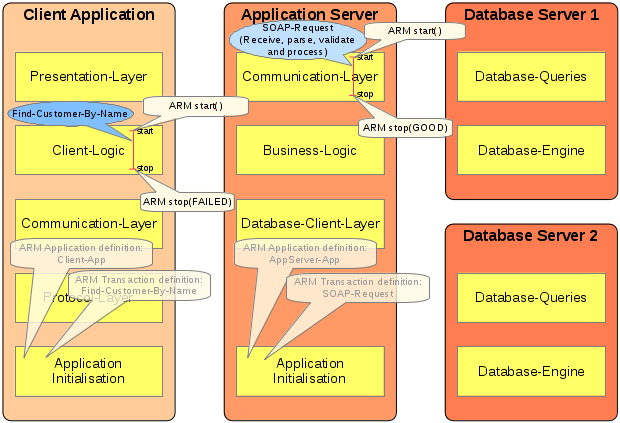
To monitor and analyse an in production environment, the first and most important task is to identify the 'Units Of Work'. They are key indicators for the application in whole or an important part of the services offered by the application. Thus you should know the application domain very well in order to identify the appropriate 'work units'.
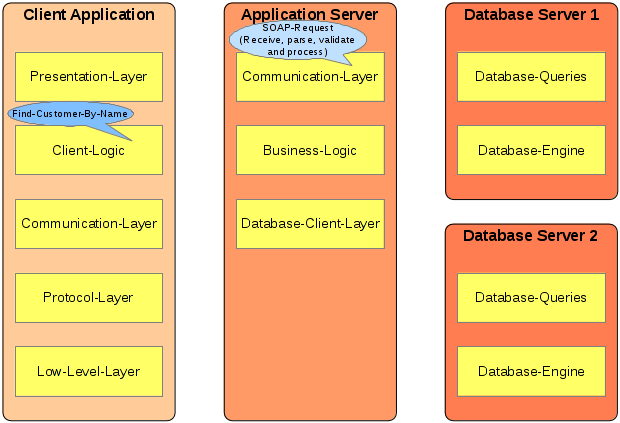
Once the important 'Units Of Work' have been (click to highlight), the application should be instrumented with calls to the ARM interface. Within ARM, an 'Unit Of Work' is called an ARM transaction.
The Find-Customer-By-Name unit of work (rendered in dark blue) is a performance key indicator for the n-tier communication from client to server and from server to the database.
The Receive SOAP Request unit of work (rendered in light blue) is used to measure the fraction of the time spent inside the server for the operation.
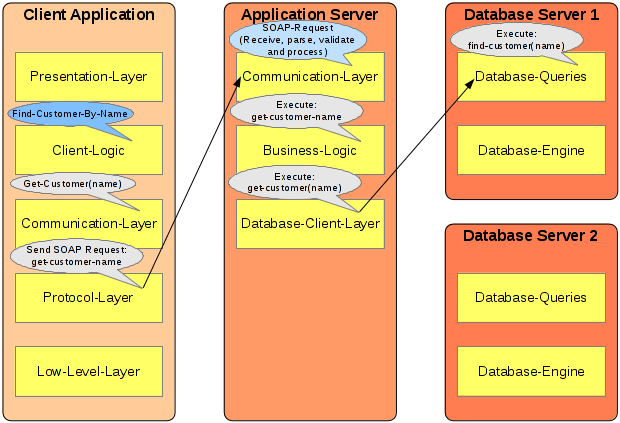
Note that for the measurements inside the client application with the measurement in the server application a so-called ARM Correlator needs to be passed from the client to the server.
In our example this can be done by passing the ARM correlator from the client to the server within the SOAP header. Read the instrumentation section to understand how to instrument with ARM.
Instrument client and server application to measure important 'Unit Of Work'
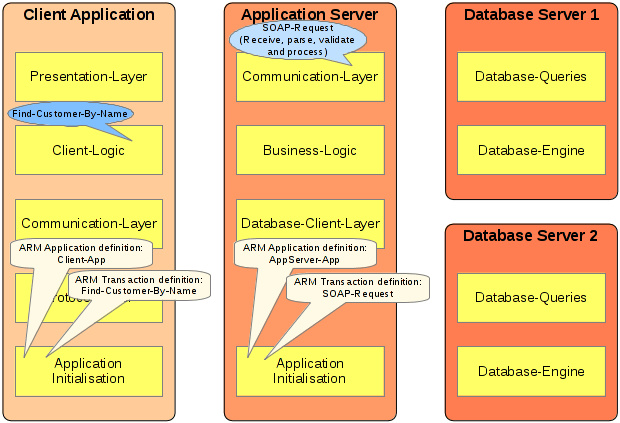
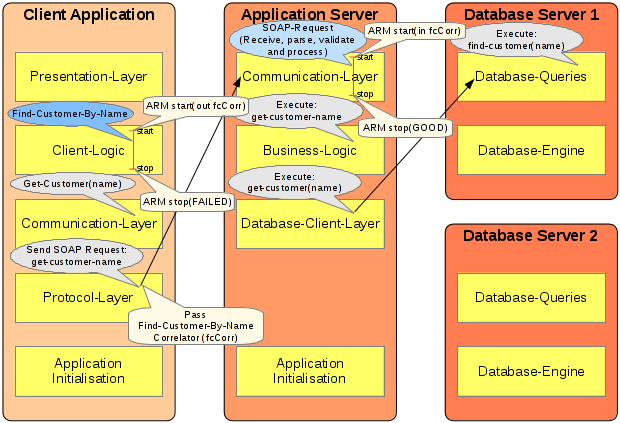
To instrument the client and server applications with ARM, appropriate application and transaction names () have to be defined:
The definitions have to be registered with the ARM implementation by using the appropriate API during application initialisation (e.g. for Java consult ArmTransactionDefinition interface to register a transaction name).
Once registered, they can be used to measure transactions by inserting calls. The ARM stop call expects a status which indicates if the transaction was successful (GOOD) or not (FAILED, ABORTED).
To the client and server measurements, the ARM start call creates an ARM correlator token (fcCorr) which will be passed to the server within the SOAP-Request. Within the server this ARM correlator token will be used as the parent correlator input argument for the SOAP-Request measurement. Thus the correlation between these two measurements is built.
Test and verify the ARM instrumentation
Make sure that your ARM instrumentation is correct and has all the information associated you need:
Deploy and monitor the ARM instrumented applications


Analyse measured transactions
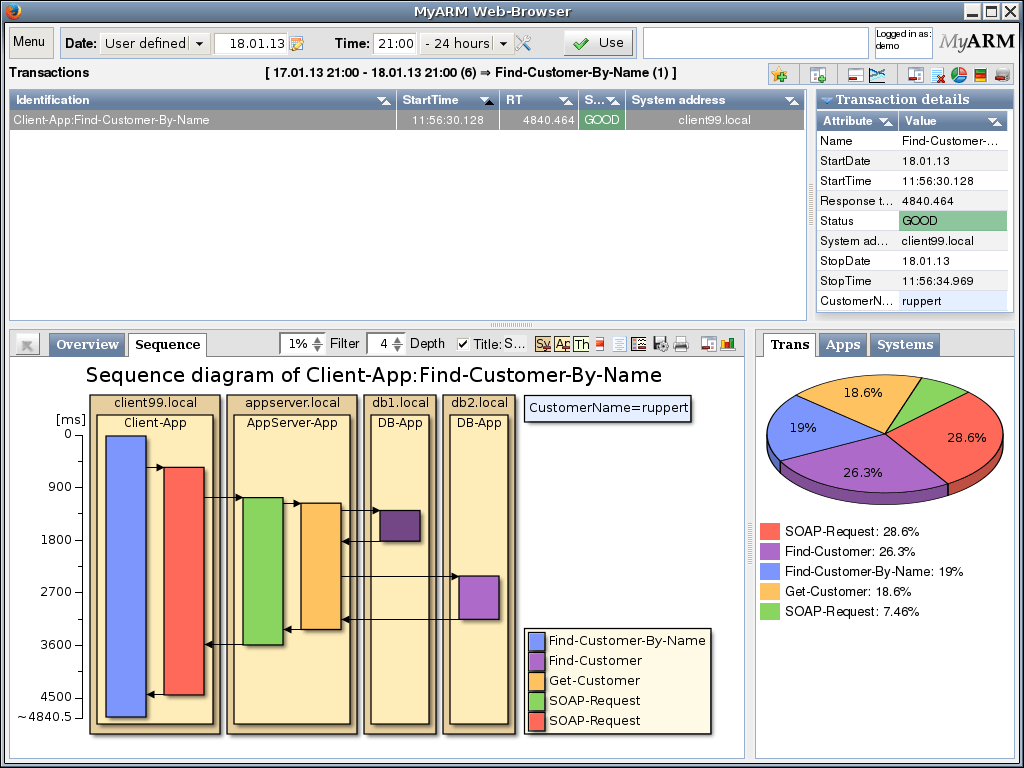
First, you can get an overview of the complete transaction measurement tree using our response time tree diagram (click on the image to enlarge):
The diagram shows which application running on a specific system calls functionality of another application running on a different system.
Digging further into the third view can be used.