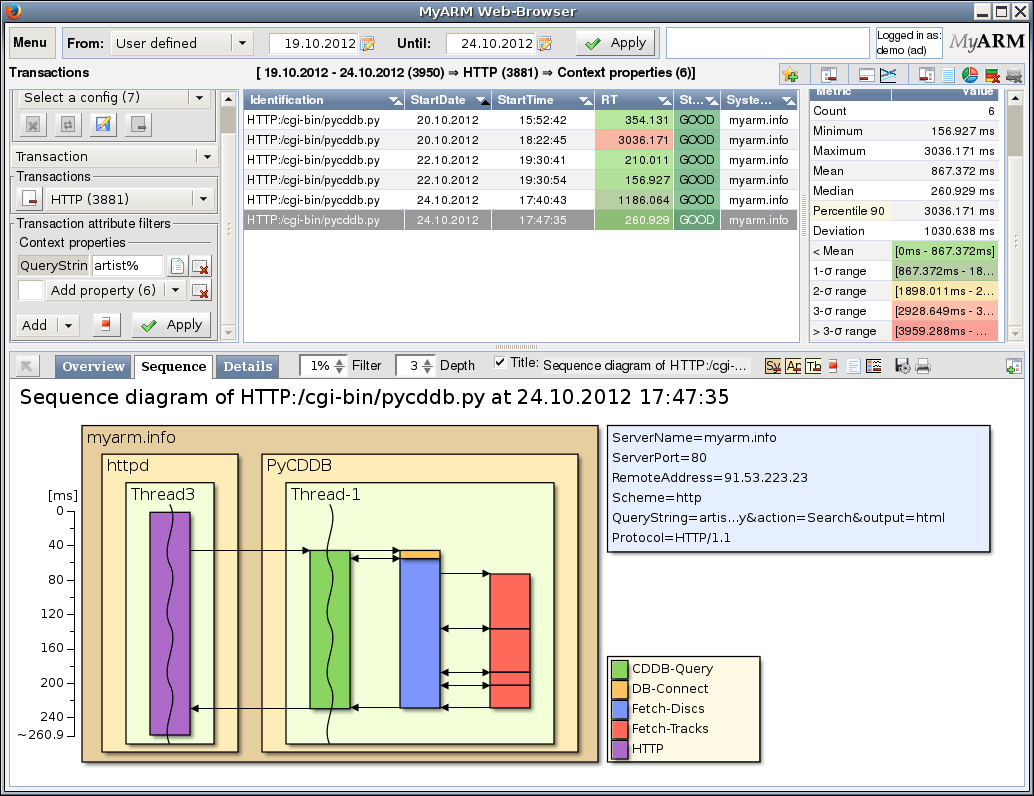
Application Performance Web Sequence Chart
The Web Sequence Chart as shown in the screenshot on the right displays measurements of our Python CDDB example. The sequence diagram shows a complete calling sequence starting with a request in the HTTP server and ending in several requests for fetching track information for CDs.
Features
- Correlation of measurements over process and/or host limits
- Associate context information to measurements (GOOD, FAILED, keys/values, etc)
- Supports single- and multi-threaded environments
- Minimal overhead per measurement (approximately 1-10 microseconds depending on the language binding and associated context)
Supported Operating Systems
- Linux® for x86 (32bit) and amd64 (32/64bit) architectures.
- Windows 10® for x86 (32bit) and amd64 (64bit) architectures
Programming Language Support
- C/C++
- Java
- C#
- Python
- Shell (korn-shell compatible)

